Energy graphs and the Bohr model: Difference between revisions
(formatting) |
No edit summary |
||
| Line 1: | Line 1: | ||
'''Allison Fain Fall 2021''' | '''Allison Fain Fall 2021''' '''Jennifer Kwak Fall 2022''' | ||
==The Main Idea== | ==The Main Idea== | ||
Revision as of 00:52, 1 December 2022
Allison Fain Fall 2021 Jennifer Kwak Fall 2022
The Main Idea
Energy graphs and the Bohr model.
This page gives a more in-depth explanation of how to use energy graphs to comprehend the Bohr model. It specifically explains how to illustrate the various aspects such as excited states and photon emissions or absorptions on the energy graphs as well as what each component corresponds to.
A Mathematical Model
The Bohr Model, as explained in more detail on the Bohr Model wiki, page depicts the atom as a small, positively charged nucleus surrounded by electrons which can only be at certain different distances from the proton to which it is bound. Energy is quantized which means that only orbits with certain radii are allowed.[1] These levels are labeled with integer N, known as quantum number, where the lowest energy state is the ground state. Beyond an energy called the ionization potential the single electron of the hydrogen atom is no longer bound to the atom. The Bohr model works well for very simple atoms such as hydrogen.
Electronic Energy levels of a Hydrogen Atom
E = K + Uelectric
1) [math]\displaystyle{ E = {\frac{mv^2}{2}} - {\frac{{\frac{1}{2}}*{\frac{1}{4π ε0}}*{\frac{me^2}{h*}}}{N^2}} }[/math]
2) [math]\displaystyle{ E = {\frac{13.6 eV}{N^2}} }[/math] where N = 1,2,3
A Computational Model
Visualize this topic given this glow script written by matter and interactions Bohr Model Glowscript [3]
Examples
Simple
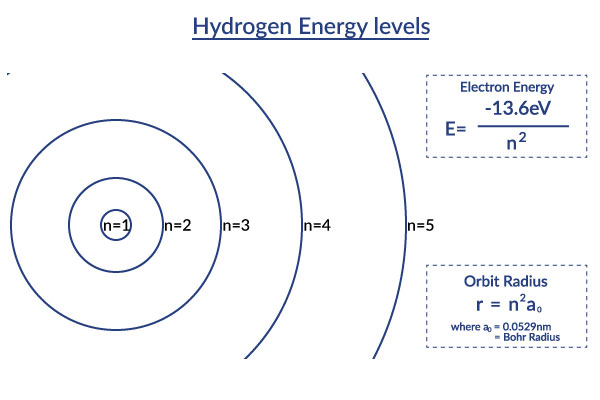
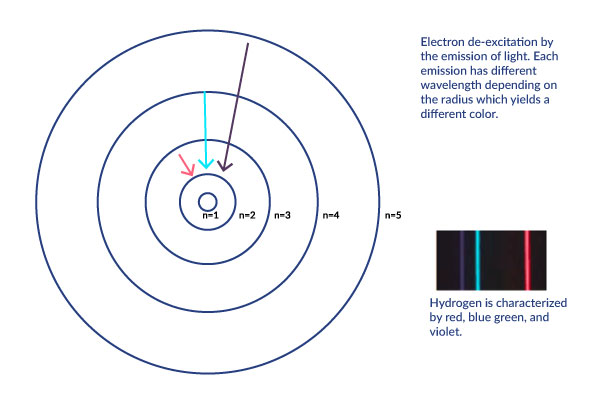
This Bohr model picture helps you visualize the orbit radii of the different excited states of the hydrogen atom described in the Bohr model. It displays how the distances in orbit radii get increasingly larger. This also means that due to the fact that the distance from the center is much larger, the ionization energy is much less. [2] The Bohr model shows us that electron orbits aren't equally spaced and that as you get farther from the nucleus (as your get more energy), the spacing between these levels decreases.
This visualization of the orbitals in a more graphical way shows that as the distance from the center becomes larger, the ionization energy is much less. [2]
Middling
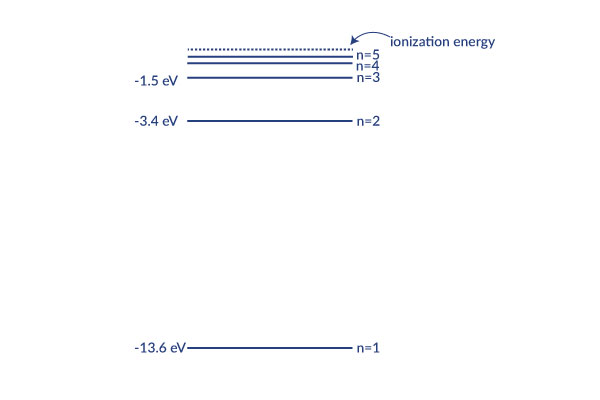
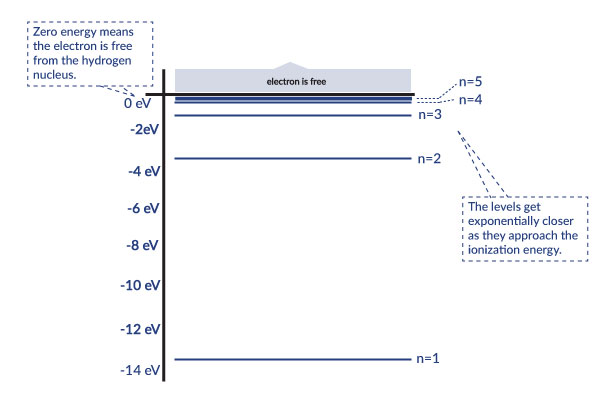
This graph explains in more detail how each level corresponds to less energy. If the energy reached zero, the electron would be free from the hydrogen nucleus because no energy is holding it on. The levels get exponentially closer as they approach the ionization energy
Difficult
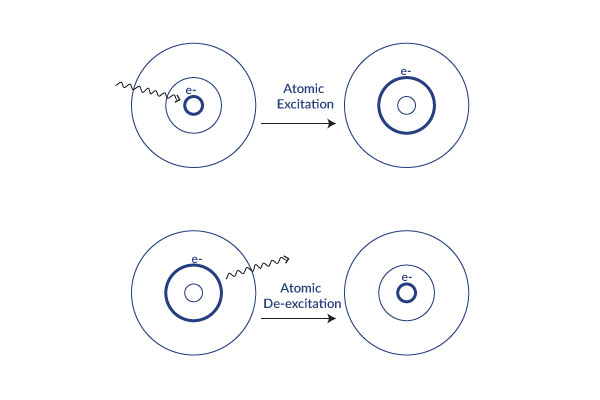
When energy is added, the electron moves up to the next orbital. This is called atomic excitation. This energy is released as a photon (light energy) and the electron moves back down.
Hydrogen specifically gives of light waves with the wavelengths that correspond to red, glue green, and violet.
Connectedness
Though it is not related to my major, one of my favorite classes I took at Georgia Tech was Earth and Atmospheric Sciences. I found it immensely fascinating when I realized that the same ideology is used as described here as is used to determine the composition of things in space. These emission spectra can be utilized to determine the type of elements that are in stars. Without this method, we would not know what stars are composed of. The ability to study the emission spectra gives us the capabilities to understand where stars come from as well as ideas of the origins of our universe. [4]
History
Ernest Rutherford created the Rutherford Model in 1911 which consisted of a planetary-model atom. His model had flaws including the fact that he thought the electron would lose energy gradually causing it to spiral inwards. However, in 1913 Niehls Bohr proposed the Bohr Model which suggested new ideas regarding the motion of electrons. These new ideas fixed the flaws in the Rutherford Model but are oversimplifications of reality. In 1925, a more accurate model of electron motion was proposed by Werner Heisenberg called quantum mechanics. Today, the Bohr model is taught as a simplified way to understand the mechanics of electrons and can be used fairly accurately in simply elements such as hydrogen, consisting of one single electron. A more complete history can be found on the main Bohr Model page.
Spectral Lines of Hydrogen Application
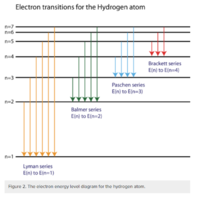
[5]
The Bohr model explains the energy levels of electrons. Atoms all have electrons that orbit the nucleus and there exists an electromagnetic force between the protons and electrons. This force contains energy and causes the atom to experience a set of quantum states. These quantum states. See below quantum states. The Bohr model visualizes the quantum states. It labels it based on the electron’s principal number (from the quantum states). Spectral emission happens when an electron moves from a quantum state with more energy to one with less energy. The difference between the initial and final state corresponds to the emitted photon (which gives us visual evidence of the transition). This emitted light corresponds to a certain spectral series. See below spectral series.
Quantum states
Each of the quantum states listed below helps to describe the characteristics of a specific electron (shell, shape, path, and spin). This gives us a better understanding of the attributes of that electron so that we can have a better understanding of the atom by analyzing the parts that make up the system. The electrons of an atom can be described using 4 quantum numbers (n, ℓ, mℓ, s). Together, all of these numbers create a unique quantum state that describes the electron in question. Each electron has a specific quantum number. Below we will proceed to define each quantum number.
Principal quantum number (n)
This describes the shell that the atom is housed in. this value (n) starts at 1 and goes until you hit the outermost valence electron shell.
Azimuthal quantum number (ℓ)

This is also called the angular momentum quantum number or orbital quantum number and describes the orbital angular momentum within the subshell. This is also where s,p,d, and f orbitals are relevant because those represent the ℓ in the equation. For this it ranges from 0 to n-1 because the “s” subshell counts as 0 and it moves up from there. Based on the angular momentum, it decides the shape of the orbital. The chart below should help clear some things up.
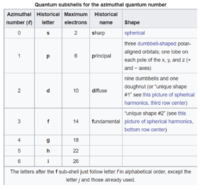
[6]
Magnetic quantum number (mℓ)
The quantum number describes the specific orbital cloud that the electron inhabits. This analyzes the projected angular momentum along a certain axis using orbitals we learned from the azimuthal quantum number. Ultimately it tells you the orientation of the orbital using the angular momentum so that you can know how the electron travels along the path within the subshell. By using the angular momentum, we can know how fast and in what direction the electron is going within the designated subshell.

Spin quantum number (s)
This describes the spin of the angular momentum (from the magnetic quantum number) to further describe the path of the electron. This is either -½ (for an electron spinning down) or ½ (for an electron spinning upwards).
Together, using the principle, azimuthal, magnetic quantum, and spin quantum numbers, we can describe the full characteristics of an electron. These all form a unique quantum state for each electron that helps determine the electromagnetic force between the protons and electron as well as the overall energy of an atom. The Bohr model helps to visualize the quantum states of a hydrogen atom and uses a shell labeling system (literally corresponding with the principle number from our quantum states).
Spectral series
Spectral series: The hydrogen spectral series is based on a spectrum of wavelengths that correspond to the photon emissions that happen during spectral emission (the energy that is emitted when an electron jumps from a quantum state with high energy to one with less energy. From here, the different colors / wavelengths are split into sections (or series) and grouped. We will discuss the different groupings below. The wavelengths are determined by the Rydberg formula. This has a number of applications outside of Physics 1 and it actually helps with astronomical spectroscopy as well as detecting hydrogen and red shifts. The Rydberg formula tells you the wavelength based on an atom’s atomic number, principal quantum number of the energy level that the electron jumps to, the principal quantum number of the energy level that the electron jumps from, and the Rydberg constant. The resulting wavelength should always be positive because n’ (the principal quantum number of the lower energy level) is always less than n (the principal quantum number of the upper energy level). Below, we will describe the spectrum emission series.

Lyman series (n’ = 1)
When an electron jumps to the first orbit (principal quantum number n’ = 1). These wavelengths are in the ultraviolet band and range from 91.175 to 121.57 nanometers.
Balmer series (n’ = 2)
The Balmer series happens when an electron jumps to the second orbit (principal quantum number n’ = 2). These lines are referred to as “H - alpha, beta, gamma”. These are on the visible part of the spectrum. These wavelengths range from 400 to 700 nanometers.
Paschen series (n’ = 3)
The Paschen series happens when an electron jumps to the third orbit (principal quantum number n’ = 3). The Paschen series lies within the infrared band and overlaps with the Brackett series. These wavelengths range from 820.4 to 1875 nanometers.
Brackett series (n’ = 4)
The Brackett series happens when an electron jumps to the fourth orbit (principal quantum number n’ = 4). The Brackett series lies within the infrared band. These wavelengths range from 1458 to 4051 nanometers.
Pfund series (n’ = 5)
The Pfund series happens when an electron jumps to the fifth orbit (principal quantum number n’ = 5). The Pfund series lies within the infrared band. These wavelengths range from 2279 to 7460 nanometers.
Humphreys series (n’ = 6)
The Humphreys series happens when an electron jumps to the fifth orbit (principal quantum number n’ = 5). The Humphreys series lies within the infrared band. These wavelengths range from 12.37 to 3.282 micrometers.
There are series beyond this but they’re unnamed. They nonetheless follow the same Rydberg equation.
See also
External links
[1][1]
References
1. http://csep10.phys.utk.edu/astr162/lect/light/bohr.html
2. http://hyperphysics.phy-astr.gsu.edu/hbase/hyde.html
4. http://skyserver.sdss.org/dr1/en/proj/advanced/spectraltypes/lines.asp
5. https://courses.lumenlearning.com/cheminter/chapter/spectral-lines-of-hydrogen/
